Here we introduce the statistical seriation concept and the different approaches associated with it without detailing the seriation parameters in PermutMatrix.
1. Introduction
Seriation, also referred to as ordination, is a statistical method that dates back more than 100 years (Petrie, 1899).
It seeks the best enumeration order of a set of described objects.
The sought order can be characteristic of the data, a chronological order, a gradient, or any sequential structure of the data.
Seriation has been successfully used in various contexts, mainly in archaeology, psychology, ecology and operational research.
In archaeology, for example, seriation has been used to date ancient objects and determine their chronology (Hodson et al., 1971). In psychology, for paired-comparaison data (Hubert and Golledge, 1981).
This approach can be used to reorganize rows or columns of a dataset so as to enumerate them in an appropriate order (Bertin, 1983).
An enumeration of rows or columns that best expresses resemblance relationships between the elements is sought.
In biology, for the treatment of gene expression data, M.B.Eisen et al. (1998) highlighted the interest of reorganizing a graphical data matrix with hierarchical clustering.
This enumerates the rows of the dataset in the order of the leaves of the hierarchical clustering dendrogram.
This reorganization often yields visually good results, however the clustering hierarchical tree does not provide an uniqueness and an optimal enumeration order for the leaves.
There are 2n-1 ways to enumerate the leaves of a binary tree.
Seriation can thus be useful to supplement the clustering approach and to better reveal the structure of gene expression profiles through the order of the leaves.
Seriation approach, however, is not limited to the optimal reorganization of the leaves of a hierarchical clustering tree.
As shown below, seriation of the rows or columns of a dataset can generally be sought independently without any hierarchical clustering.
|
|
|
|
|
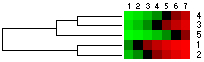
(a) Original data matrix |
(b) Data matrix after cluster analysis of rows |
(c) Data matrix after cluster and seriation analysis of rows |
|
Fig 1. Seriation can be useful as a supplement to clustering approach and to better reveal the dataset structur. |
||

2. General principles
All seriation methods proceed by optimizing a numerical criterion which is different for each method.
Each criterion is intended to address a specific reorganization concern, and gives each method its distinctive properties.
PermutMatrix especially uses criteria built from matrix D of dissimilarities between elements to be seriated.
This square symmetrical matrix contains measurements of resemblance between pairs of elements.
It is computed on the basis of the initial dataset by using an appropriate analytical expression.
In PermutMatrix, the usual Euclidian distance or one of the two Pearson distances can be used.
Reorganization of the dissimilarity values in D induces seriation of the initial dataset.
This reorganization is carried out by simultaneous and synchronized shifts of rows and columns in D.
|
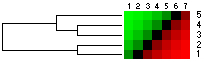
(a) |
(b) |
(c) |
|
|
|
|
|
Fig 2. Dissimilarity matrix D between rows for each data matrix displayed in figure n°1. Reorganization of the dissimilarity values in D induces seriation of the initial dataset. In column (c), low dissimilarity values are close to the diagonal. Close elements are close in the enumeration. |
||


There are two types of criteria:
• criteria that emphasize the distribution of dissimilarity values along the diagonal of D,
• criteria that measure the global fit of the dissimilarities of D with rank differences in the enumeration of elements.
We will introduce each of these criteria types through general notions and straightforward and intuitive ideas that characterize each of them.
2.1 Criteria based on the position of dissimilarities along the diagonal of D
These criteria are designed to measure, in D, the distance of low dissimilarity values to the main diagonal of D.
On the basis of these criteria, seriation consists of bringing low dissimilarity values as close as possible to the diagonal of D.
This shift of values is implemented via synchronized permutations of rows and columns in D.
The principle is that if two elements have a low dissimilarity values and this value is close to the diagonal of D, then this two elements will be close in the enumeration of rows and columns of D.
The enumeration order thus respects neighborhood and proximity relationships according to D.
The seriation solution is the optimal enumeration order according to the chosen criterion.
a -Minimum path length criterion
One widely used criterion is the sum of dissimilarities between adjacent elements in the linear seriation enumeration.
It takes into account only dissimilarities between elements located side by side into seriation.
This sum is the path length connecting all elements in seriation order.
If this sum is low then close elements in the seriation order are similar according to D.
Simple example n°1 |
Dissimilarity matrix D |
Graphical representation of D |
Graphical data matrix |
|
Sum of dissimilarities between adjacent elements S = 28.97 |
|
|
|
|
Sum of dissimilarities between adjacent elements S = 10.57 Close elements in the seriation order are similar according to D |
|
|
|
In the general case, optimization of this criterion is too complex for an exact solution to be found in a reasonable time (this problem is NP-complete).
This approach can thus only be implemented through heuristics or with simplifying constraints.
A good solution is to require that elements to be seriated have a hierarchical clustering structure.
In this situation, Bar-Joseph et al. (2001) gave an exact algorithm which yields the optimum of this criterion within reasonable time. It runs in time O(n4).
This algorithm is implemented in PermutMatrix.
b - Multiple-fragment heuristic
This method proceeds through successive steps. At each step, the smallest available dissimilarity is placed against the diagonal of the dissimilarity matrix, without modifying the position of dissimilarities already established in the previous steps.
This progressive seriation method attempts to put the closest elements side by side without breaking the already established neighboring associations.
At each step, the gap between the cell containing the lowest current dissimilarity and the diagonal of D is minimized.
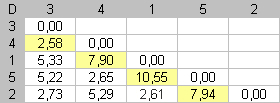
Simple example n°2 |
Dissimilaritiy matrix D |
Graphical representation of D |
Graphical data matrix |
|
|
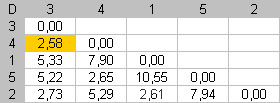
Step 1 |
The smallest dissimilarity in D is 2,58. This value is already near the diagonal. No movement is necessary at this step. |
|
|
|
|
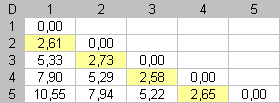
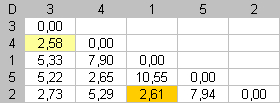
Step 2 |
The dissimilarity between items 1 and 2 is now the smallest dissimilarity available. Dmin = 2,61. To put this value against the diagonal, we swap items 2 and 5. |
|
|
|
|
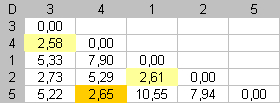
Step 3 |
At this step, the dissimilarity between items 4 and 5 is the currently smallest dissimilarity. Items 4 and 3 were pooled at the first step and we are not allowed to modify this pair. We must put item 5 between items 4 and 1. At the end of this step, items 3, 4 and 5 form a "fragment" of three elements. |
|
|
|
|
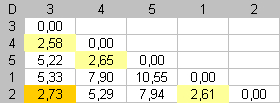
Step 4 |
For
the final step, the dissimilarity between items 2 and 3 is the smallest
dissimilarity available. To put this value against the diagonal, we
swap fragments |
|
|
|
|
End |
At the end of this algorithm, small dissimilarities are spread along the main diagonal of D. Close elements are close in the seriation. |
|
|
|
This iterative algorithm is straightforward and fast because it is a greedy process, it never questions the prior steps.
This is an advantage, but it can have drawbacks.
The choices made at the beginning of the seriation process can ultimately lead to irrelevant results.
However, the time savings can offset this potential drawback.
Moreover, the last matched elements are often distant elements that are easier to seriate than close elements.
Hence, the organizational clumsiness is usually minor, and has little impact on the final organization.
This approach therefore usually yields very good results.
It can also be implemented with big datasets.
It corresponds to the sequential procedure proposed by Gelfand (1971), in the context of the seriation of archaeological objects, and to the multi-fragment heuristic (Bentley 1992) for the traveling salesman problem (TSP).
c - Bipolarization method
This approach proceeds in a contrary manner.
Instead of explicitly attempting to group low dissimilarities along the diagonal, it attempts to push the high dissimilarity values away from the diagonal.
This method also proceeds step by step.
At each step, the smallest available dissimilarity is placed in the farthest cells from the diagonal of the dissimilarity matrix, without modifying the position of dissimilarities already established in the previous steps.
The left-down corner of the dissimilarity matrix is filled with dissimilarities as high as possible
Simple example n°3 |
Dissimilarity matrix D |
Graphical representation of D |
Graphical data matrix |
|
|
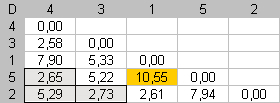
Step 1 |
We want to fill the lower left corner with dissimilarities that as high as possible. First, the highest dissimilarity in D is placed in the downward angle of the matrix. This defines the seriation extremities. Dmax = 10.55. To put this value in the lower left corner, we put item 2 and item 5 at the enumeration extremities. |
|
|
|
|
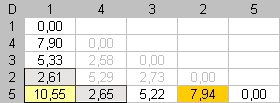
Step 2 |
In the second step, only dissimilarities contained in the first column, and the last row, are available for searching an optimal assignment. We must respect item positions established at the first step. Dmax = 7.94. This dissimilarity value is placed in the downward angle of the matrix by putting item 2 next to item 1. We search the most different item from one of both extremities of the seriation and put this item, in the seriation order, as far as possible from this extremity. |
|
|
|
|
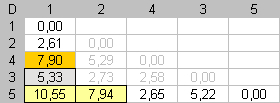
Step 3 |
In the third step, the most different item, from the other extremity, is searched and placed as far as possible from this extremity. Dmax = 7.90 |
|
|
|
|
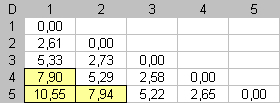
End |
Alternately an item is placed on one side of the seriation, by opposition to the other extremity of the seriation. At the end of this algorithm, high dissimilarity values will be far from the main diagonal of D. Far elements will be far in the seriation enumeration. |
|
|
|
This algorithm is even faster than the previous one.
From the second step the algorithm can be considered as a search of the n-2 highest dissimilarities contained in the first column and the last row of D.
The resulting reorganization is often less satisfactory than the results obtained by the two previous methods.
However, this method yields very good results when there is bipolar organization in the data, i.e. when there are two extremes between which the other elements are located.
For example, this method gives better results than the others with data derived from a multidimensional elongated Gaussian distribution ( Example ).
Hence, searching for a minimal path length is not relevant.
This path can be sinuous, and meander needlessly through the data.
Conversely, in such conditions, it is relevant to enumerate elements in the order underlying the general elongation of the Gaussian distribution by enumerating elements according to their distance to the two endpoints of the distribution.
2.2 Criteria measuring the quality of the dissimilarity adjustment
When an enumeration of objects is available, it is natural to define a distance between two elements as the gap between their ranks in the enumeration.
For example, in a statistical dataset, rows are enumerated one after another.
Then the gap, or distance, between two rows is the difference between their ranks.
Two contiguous rows will have a distance of 1, and the first and last rows will have a distance of n-1.
If
![]() is the distance between i and
j, then by definition:
is the distance between i and
j, then by definition:
![]()
Moreover, we have the matrix D of dissimilarities computed from the data matrix.
It reflects similarities between pairs of elements according to their description in the statistical dataset.
a - Least squares criterion - Unidimensional scaling
A natural seriation
criterion is to measure the adequacy between D and
![]() .
.
The sum of squares of deviations between
dissimilarities in D and distances ![]() is computed.
is computed.
![]()
Seriation attempts to minimize this criterion by reorganizing rows and columns in D by simultaneous synchronized permutation.
The linear enumeration that makes gaps between ranks as close as possible to the dissimilarities in D is sought.
This approach is related to the statistical unidimensional scaling method (McIver and Carmines, 1981).
Many studies were have focused on this subject, and various algorithms have been proposed to optimize this criterion.
One of the difficulties of this approach is that d values are integers, whereas D values are real values. This gives rise to discontinuity problems which hinder the search for the optimal solution.
In PermutMatrix, we propose two heuristics, one combinatory and one numerical.
The first one is greedy and optimizes the criterion by iteratively maximizing the gradient.
At each step, an inversion of two elements is sought so that the criterion will be as improved as possible.
This rough heuristic quickly yields a solution that is often close to the global optimum.
This is usually sufficient for exploratory work conducted in PermutMatrix.
However, in this algorithm, calculations
at each stage are long O(n3) and the number of stage indefined.
This algorithm could be impracticable for large dataset but it can be very
useful for small data set or for intra-class reorganization in a clustering
tree not totally ramified (see further).
The second heuristic is numerical.
In the first step, it involves searching for the best unidimensional representation of dissimilarities via the method of Torgerson (1958).
If D is computed with usual Euclidian metrics, then this method consists of finding the first principal component of the dataset.
The approximate seriation is the enumeration of elements in the order of projections on the first principal component of the dataset.
b - Inertia criterion
|
|
This criterion searches for a global trade-off for placing dissimilarities in D. The diagonal of D is considered as a symmetry axis around which the different dissimilarities are positioned. Cells of matrix D are located various distances from this axis. The moment of inertia of dissimilarity values around the diagonal can thus be defined. The further a high dissimilarity is placed from the diagonal, the more it will contribute to increasing the inertia criterion.
In this situation, seriation involves finding the element enumeration that maximizes the inertia. High dissimilarities are thus placed as far as possible from the diagonal, and low values are placed along the diagonal. |
This criterion is quite analogous to the previous one and it also provides a global measurement of the seriation adequacy.
It can be shown that both criteria differ only by a weighting factor given to the cells in D.
To optimize the inertia criterion, PermutMatrix offers two heuristics, one numerical and one combinatory.
Both are very close to those introduced above. However, analytical simplifications can be made thanks to quadratic aspect of the criterion optimized.
For the combinatorial algorithm, calculations at each stage are in O(n2). They are faster than above.
This criterium could be practicable for dataset with less than n=1.000 genes.
3. How to choose a criterion or seriation method
As with clustering, the PermutMatrix user is confronted with a broad range of seriation methods and has to choose one of them.
There is no universal answer to the choice problem.
None of the methods is better than the others in all situations.
As with clustering, each seriation approach gives specific insight into the data.
The final result is obtained by implementing several methods and comparing their results.
PermutMatrix allows the user to easily test several approaches.
Its work environment features and its graphical handling of data substantially facilitate analysis and exploratory work.
Several reorganization methods should thus be tested and the user will then select the one that best highlights the data structure.
In PermutMatrix, it is possible to assess different row or column shifts.
Several handling possibilities are proposed, e.g. inversion, transposition and sorting.
The stability and robustness of an automatically-obtained result can then be tested empirically.
It is also possible, through manual handling, to find a sub-optimal solution which accounts for exogenous aspects of the data that are not considered by the optimized criterion.
The program is designed to help in finding a relevant and operational enumeration via various efficient automatic methods, as well as with manual handling in order to adjust an automatically-acquired result.
4. Simple seriation or tree-based seriation?
As explained above, seriation can be performed after a preliminary hierarchical clustering - this is seriation under tree constraints.
All criteria detailed above can be used in this situation without modification, but the algorithms to find the optimum differ. Tree-based seriation is less complex to implement so it is much faster.
However, the complexity of the preliminary hierarchical clustering is usually O(n3).
Tree-based seriation often yields better results than direct seriation without clustering.
This is due to the fact that the seriation is complicated when there are several data gradients.
This happens with multidimensional data, which cannot be represented in a single dimension.
Preliminary clustering reduces the seriation degree of freedom and makes it easier to obtain a unidimensional result.
If there is only one gradient in the data, then the preliminary clustering is not necessary, and it may even hinder the seriation process.
Note that if the data matrix can be set as a Robinson matrix (1951), then all the methods programmed in PermutMatrix will produce the same result.
This is the simple case of a perfect seriation.
This ideal situation hardly ever arises, however, and the use of several seriation methods is usually the best way to search for a satisfactory optimal reorganization.
A hybrid approach can improve the seriation results.
After computing a hierarchical clustering tree, a set of classes can be manually identified in PermutMatrix.
These classes will have to correspond to terminal ramifications, without any objective justification.
The elements associated with these ramifications are close with respect to D.
Then a class is a group of similar elements that cannot be classified.
The elements of a class can then be released from the tree constraint and reorganized by seriation within the class.
Only the global tree structure of the class will be reorganized by seriation under tree constraints.
Intra-class reorganization is performed without constraints, whereas inter-class reorganization is done under tree constraints.
Note, finally, that when the clustering tree is not totally ramified (i.e. when there are identified classes), PermutMatrix allows two different seriation criteria to be used simultaneously, i.e. one for simple seriation for local analysis (intra-class) and the other tree-based seriation for the global reorganization (inter-class).
5. References
Bar-Joseph, Z., Gifford, D. and Jaakkola, T. S. (2001) Fast optimal leaf ordering for hierarchical clustering. Bioinformatics, 17, S22-S29.
Bentley, J. L. (1992) Fast Algorithms for Geometric Traveling Salesman Problems. ORSA Journal on Computing, 4, 387-411.
Bertin, J. (1983) Semiology of graphics, Diagrams Networks Maps. University of Wiscousin Press, Madison, Wis.
Eisen, M. B., Spellman, P. T., Brown, P. O. and Botstein, D. (1998) Cluster analysis and display of genome-wide expression patterns. Proc. Natl. Acad. Sci. USA, 95, 14863-14868.
Hodson, F. R., Kendall, D. G. and Tautu, P. (1971) Mathematics in the archaeological and historical Sciences. Edimburg University Press, Edimburg.
Gelfand, A. E. (1971) Rapid seriation methods with archaelogical application. In : Hodson, F. R., Kendall, D. G. and Tautu, P. (eds), Mathematics in the archaeological and historical Sciences. Edimburg University Press, Edimburg.
Hubert, L. J. and Golledge, R. G. (1981) Matrix reorganization and dynamic programming: Applications to paired comparaisons and unidimensional seriation. Psychometrika, 46, 420-441.
McIver, J. P. and Carmines, E. G. (1981) Unidimensional scaling. Sage Publications, Beverly Hills, CA.
Petrie, W. M. F. (1899) Sequences in Prehistoric Remains. The Journal of the Royal Anthropological Institute of Great Britain and Ireland, 29, 295-301.
Robinson, W. S. (1951) A method for chronologically ordering archaeological deposits. American Antiquity, 16, 293-301.
Torgerson, W. S. (1958) Multidemensional Scaling, Theory and Methods of Scaling. John Wiley & Sons, New York, NY, pp. 247-297.